About IMAE
Monthly Indicator of Economic Activity project in the regions of Colombia
There is no official quarterly estimate of the Gross Domestic Product (GDP) for the Valle del Cauca region in Colombia. This information is only available at a national, macroeconomic level. At a regional level, only one global GDP figure is published, annually, several months after the end of each fiscal year. Therefore, businesses and households have to do with lagging specific data on a regular basis.
In 2015, a team of researchers from the Pontificia Universidad Javeriana Cali and economists from the Banco de la República (Colombia’s central bank) joined efforts to develop the Monthly Indicator of Economic Activity (IMAE, in Spanish) for the Valle del Cauca Region. Due to its novelty—this initiative is the first of its kind in Latin America, both in its scope and in its methodological approach—the IMAE’s methodology was published in the Latin American Research Review journal.
In 2017, the Banco de la República replicated the IMAE’s methodology for the Antioquia region and in the city of Cali, the latter in partnership with the local government’s Secretary of Economic Development. Additionally, jointly with the City of Cúcuta’s Chamber of Commerce, another IMAE was developed for the Norte de Santander region.
From its first implementation, the IMAE results have been published in the IMAE Economic Activity Report, an Universidad Javeriana Cali’s quarterly publication, and in the Banco de la República’s Regional Economic Bulletin for the Southwestern Colombian Region. Each IMAE update reports whether regional economic activity is accelerating or decelerating (nowcasting). Notably, the IMAE is not intended to replace the annual GDP data produced by the national statistics agency (DANE, in Spanish), but rather to supplement it, providing a timely growth estimate when the DANE data is not readily available (yet). In fact, both indicators coincide in their historical evolution (Figure 1), but the IMAE has proven to be able to anticipate the GDP growth turning points each year and to closely anticipate the official DANE growth data. (Figure 2 shows the forecasting performance of IMAE).
Figure 1. Trajectory of the Valle del Cauca IMAE*
June 2004 – June 2019
UM: Annual growth rates (%), Base 2015
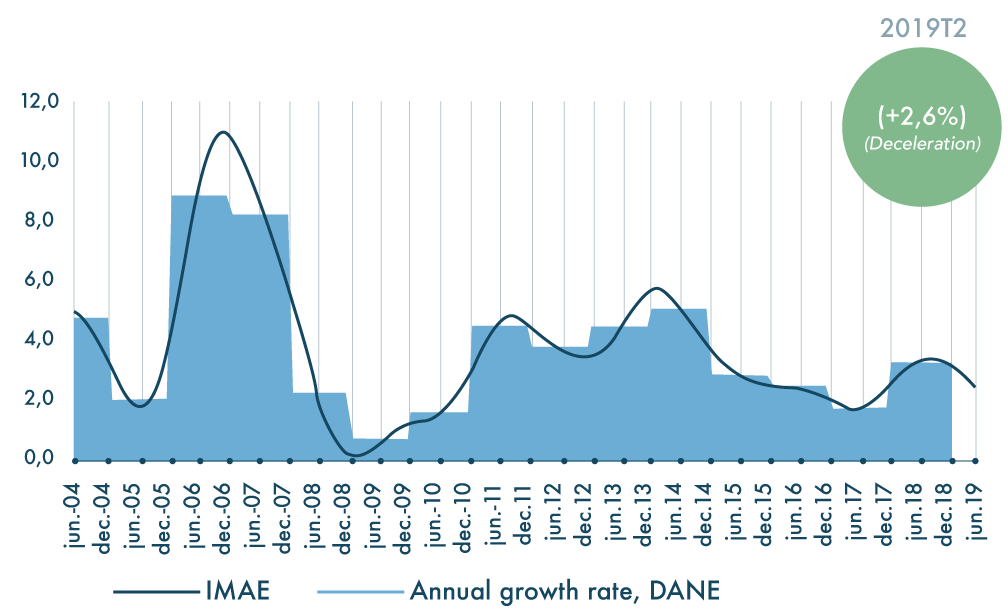
Source: Department of Economics, Pontificia Universidad Javeriana Cali and Regional Center of Economic Studies Cali, Banco de la República.
*An increase (decrease) predicts a GDP acceleration (deceleration), leading, in turn, to an increase (decrease) in the regional economy’s growth rate.
The methodology for the construction of the IMAE combines advanced econometric time series techniques, such as the Dynamic Factorial Model (DFM) and the Structural Univariate Model. Signs concerning the state of the economy are extracted by estimating the comovement in the regional main variables, which are related to the region’s most important sectors and economic activity components.
This methodology enables the selection of the most relevant variables to estimate growth and the definition of appropriate weights for each variable (seasonality and atypical data are removed from all variables):
- Ground sugar cane (14.3%),
- Cement dispatches (4%),
- Energy consumption – non-residential sector (6.9%),
- New vehicle sales (7%),
- Exports at constant prices (6.4%),
- The Regional Industrial Production Index (23,5%),
- Imports at constant prices (1,9%),
- Packaging volume (14,3%),
- Gross credit portfolio (0,1%)
- Retail sales (0.3%),
- Cali Consumer Confidence Index (ICC, in Spanish) (1.3%), and
- Freight tolls (8%)
The weights are estimated using the DFM and are updated according to changes in the economic conditions that determine the economic cycle. In addition to this flexibility, we use variables within the IMAE that are related to business activity as a whole (packaging, credit, energy consumption, and tolls). These two characteristics allow us to achieve an acceptable estimate of growth with a few, straightforward variables. Another IMAE’s value-added is that it is not a black box. On the contrary, it explicitly and instructively explains where the estimated growth figure comes from. Furthermore, it explains the growth evolution for each of the IMAE variables (Figure 2).
Figure 2. Dynamics of the variables within the IMAE in the first and second quarter of 2019*
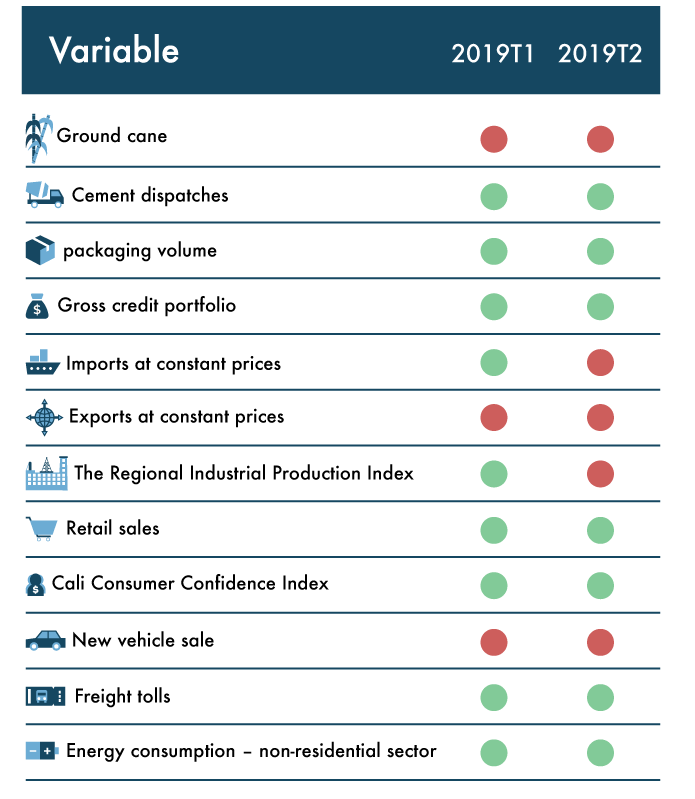
Source: Department of Economics, Pontificia Javeriana University of Cali.
* The colors represent the sign of the interannual growth rates: blue (positive) and red (negative). The rates are calculated
according to the seasonally adjusted and corrected series of atypical data and compared with the same quarter of the
previous year.
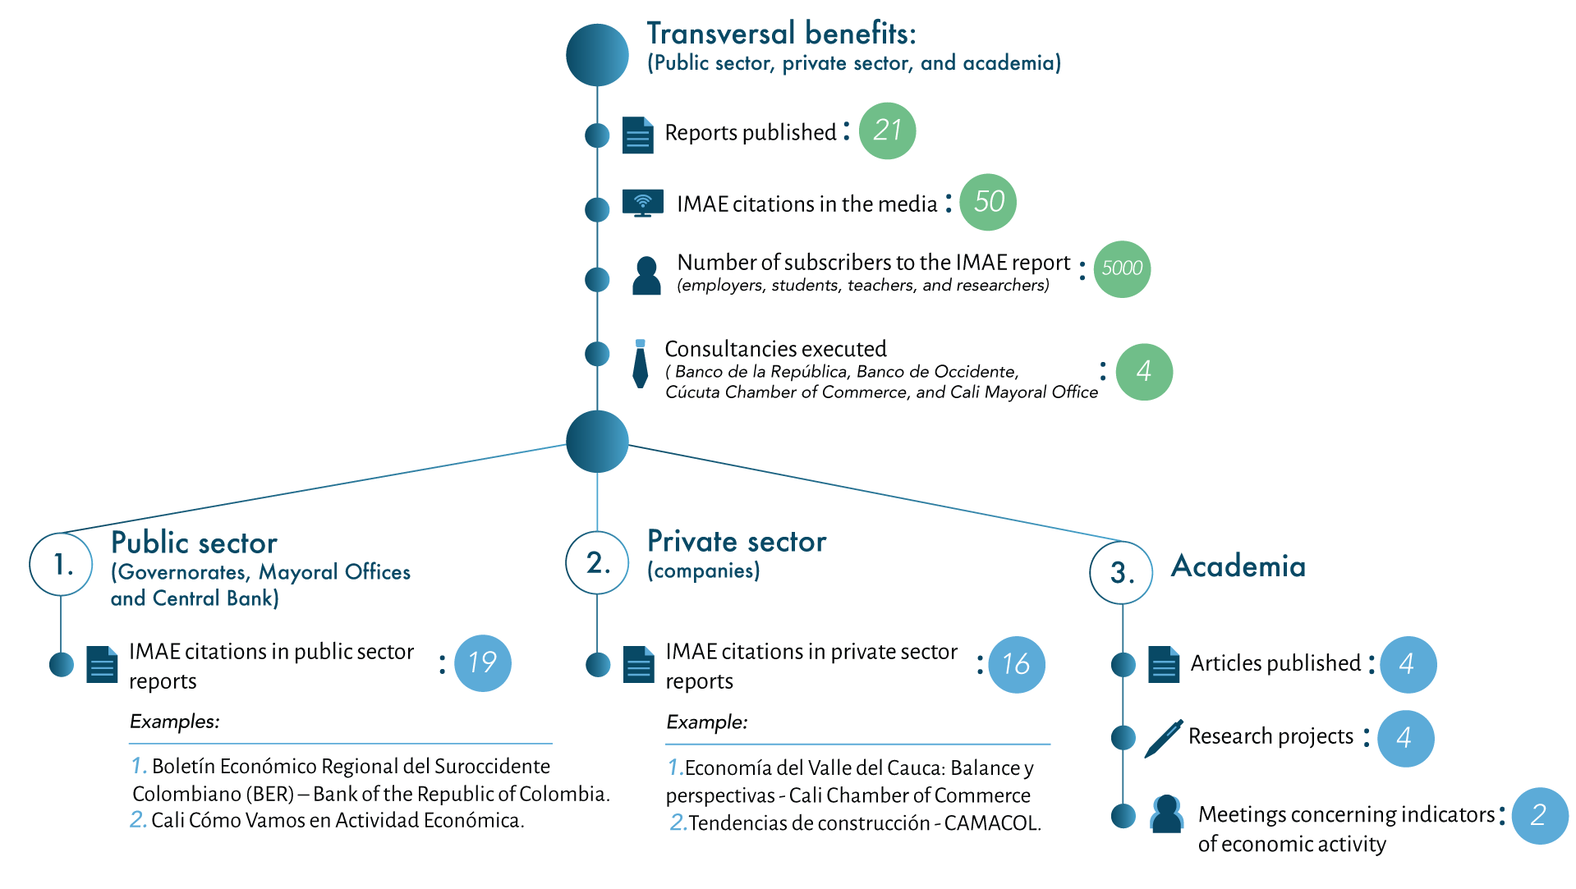
The IMAE project has had a significant impact at the regional and national levels (Figure 4). In its different versions, the IMAE has been applied in numerous areas and research projects, and it has had a significant impact amongst academics and practitioners, in the public and private sectors. It has become the regional reference for understanding changes in the economy of these departments and the economy of the city of Cali, and has therefore achieved great credibility within academic, business, and government networks. The number of subscribers who receive the IMAE report quarterly has reached 5,000 people and the indicator has been used in approximately 35 reports (public or private sector) since 2015, and it has been a fundamental input for at least four major research projects, four peer-reviewed journal publications, and two scientific meetings on economic activity indicators.
National media have also facilitated the dissemination of the IMAE findings. There has been 52 journalistic articles about IMAE in the media since 2015. Although the IMAE methodology is not easy to understand outside of academia, the final result and its utility is understandable and has been valued and used by the general public and the press.
Figure 3. Impact of the IMAE